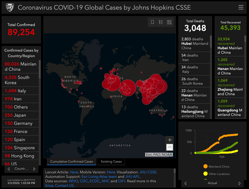
The map allows you to see which parts of the world are impacted the most by it.
A chart is placed to the left of the map showing the number of confirmed cases for specific countries, states, and cities.
Two charts are placed to the right of the map.
Image: https://www.arcgis.com/
{iframe}https://www.click2houston.com/news/national/2020/02/29/interactive-map-from-johns-hopkins-shows-coronavirus-spread-in-real-time/{/iframe}
